Objective-C .dylib Reverse Engineering "gigavaxxed" with Binary Ninja & LLDB
[UPDATE] - source code now available here.
First, the results, then - many words
PS. Warning, this post contains lots of black & unfunny IT humor.
The complexity of this technique
Just press a button (yep, that’s it):

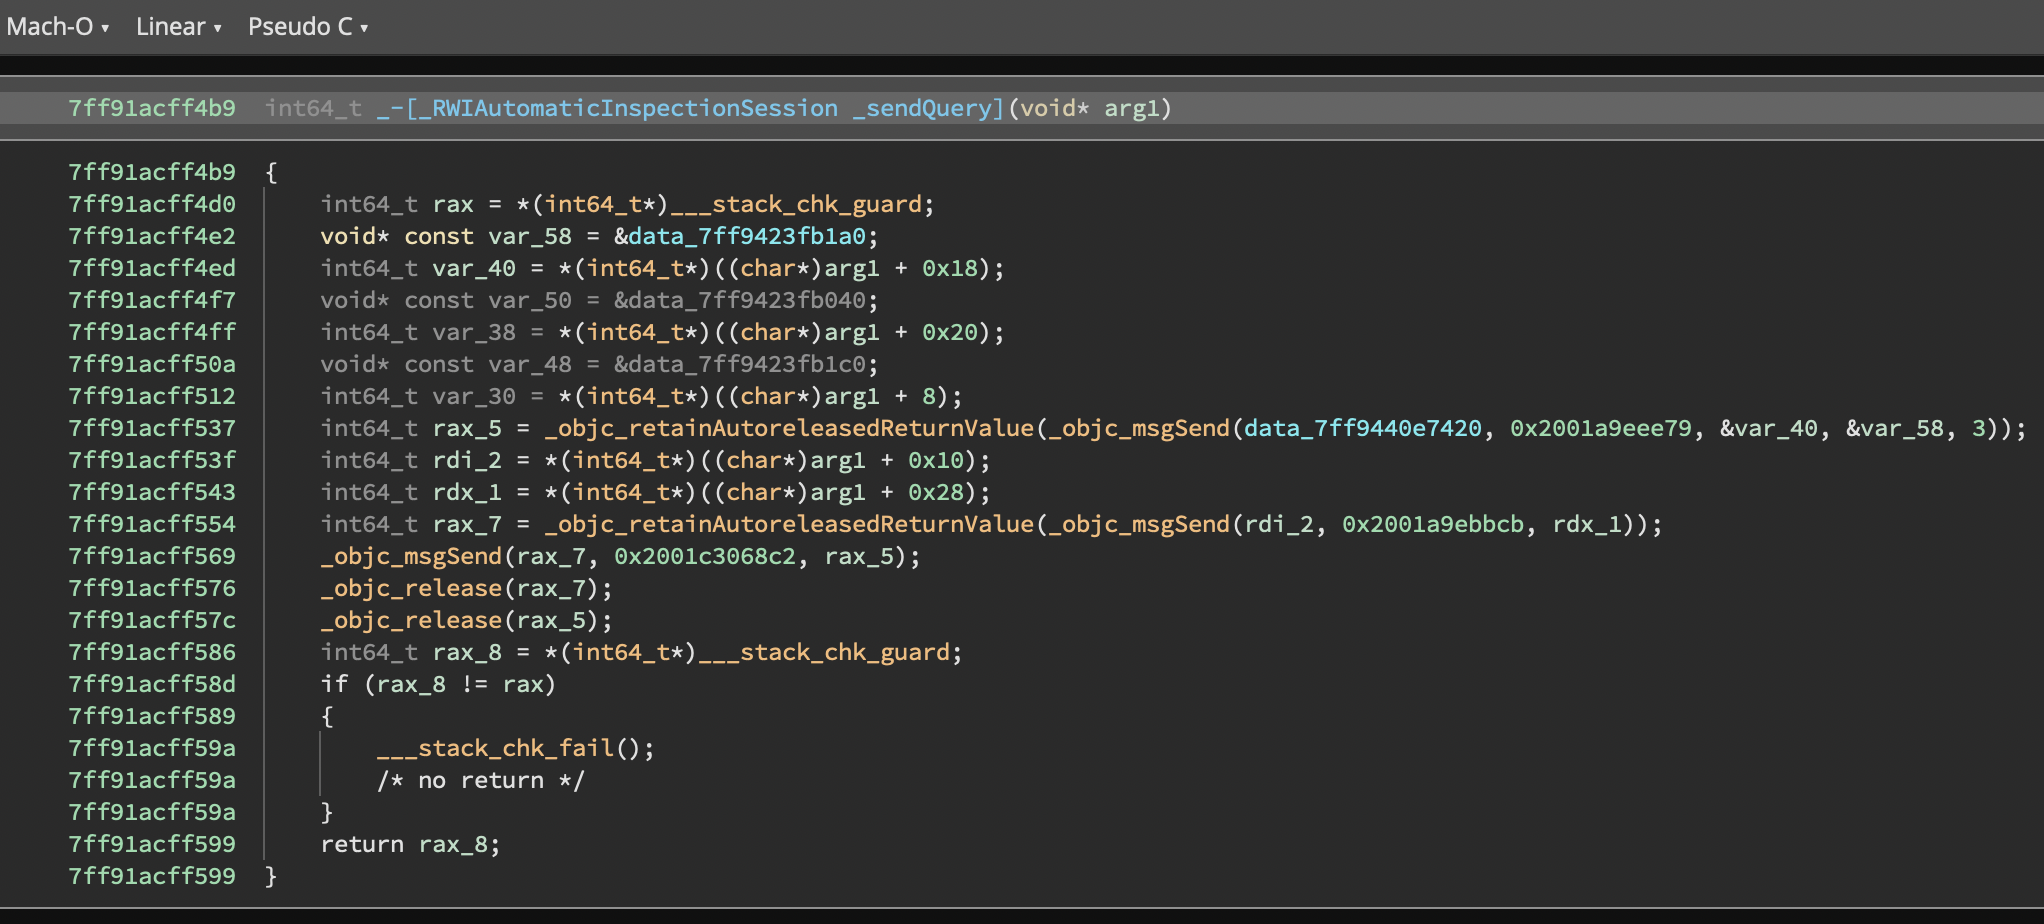
With vs Without
Without the plugin (Pseudo C)
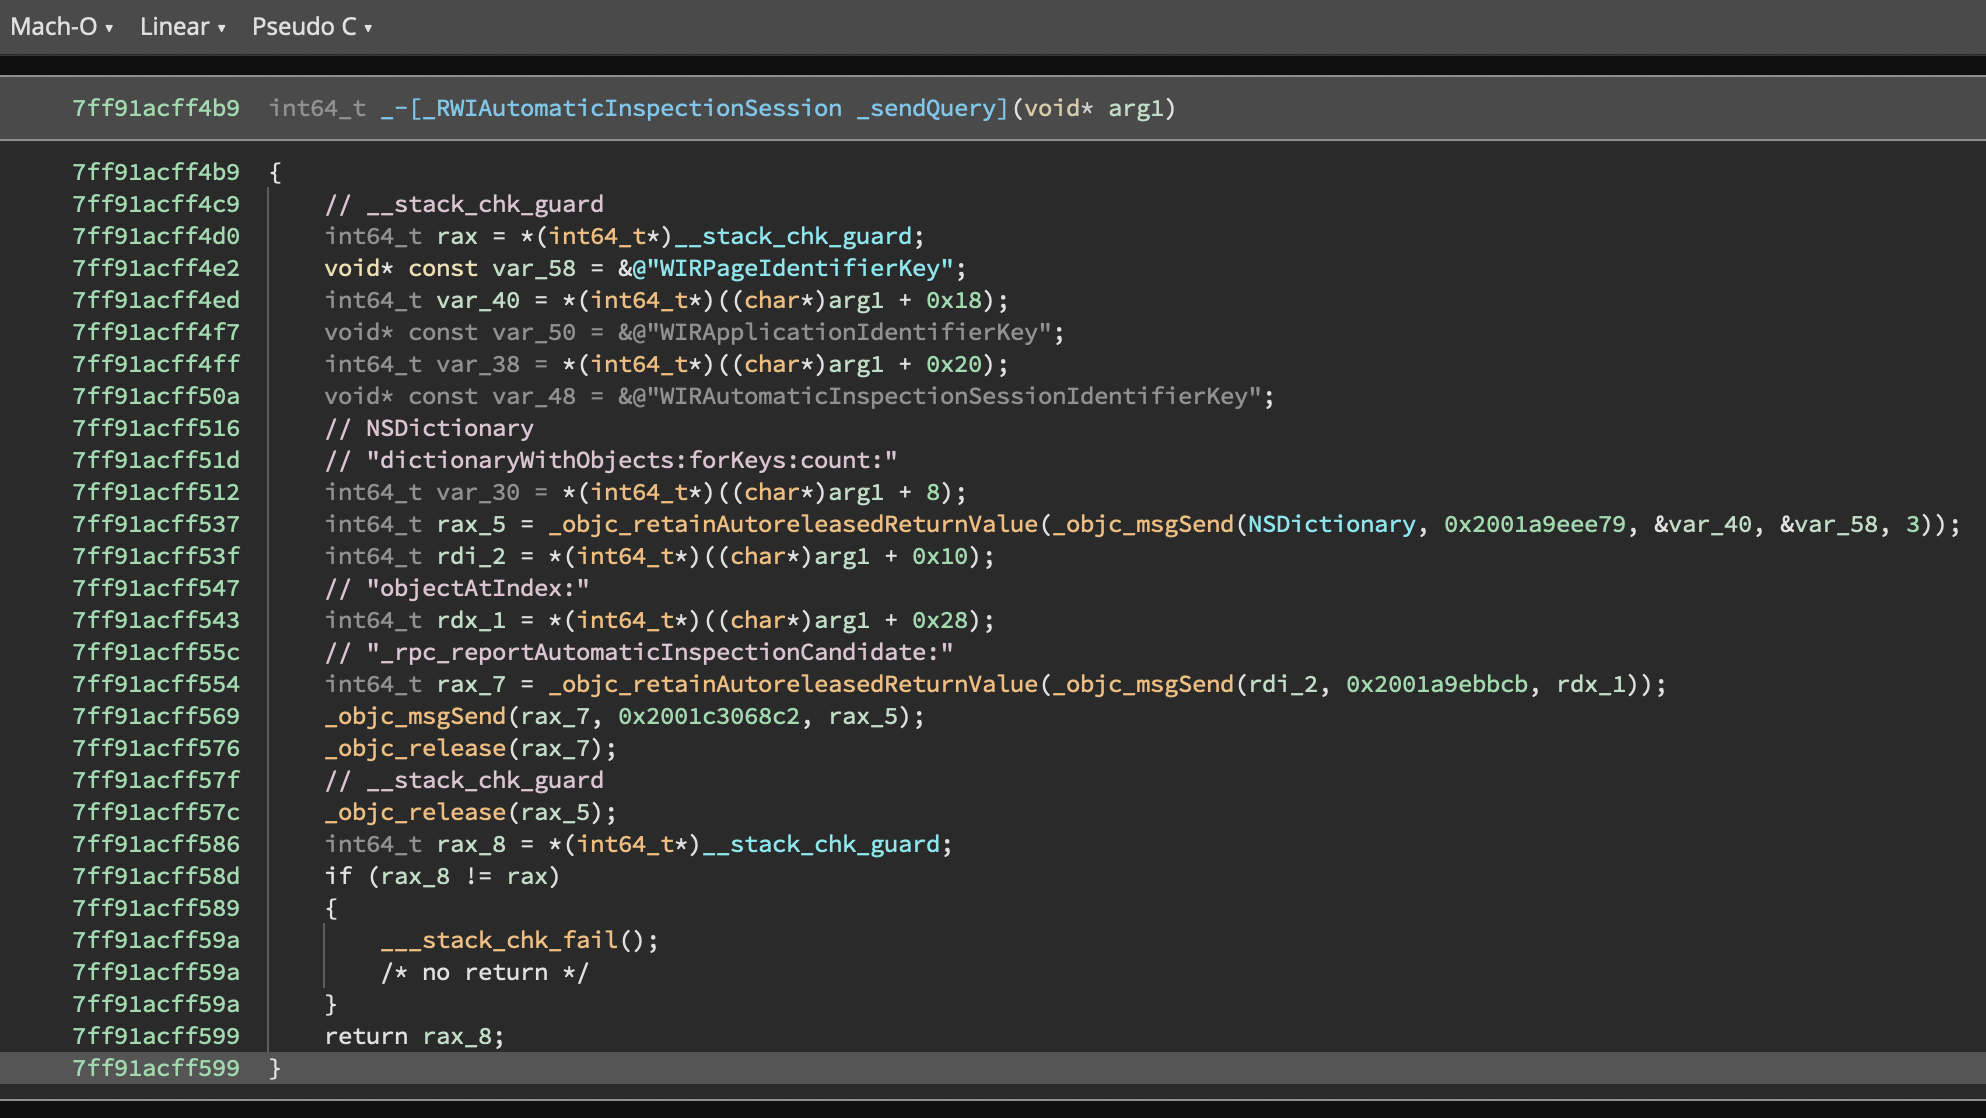
With the plugin (Pseudo C)
Note that selectors are displayed as comments, before the objc_msgSend call. Objective-C classes, strings, protocols, etc are displayed as well:
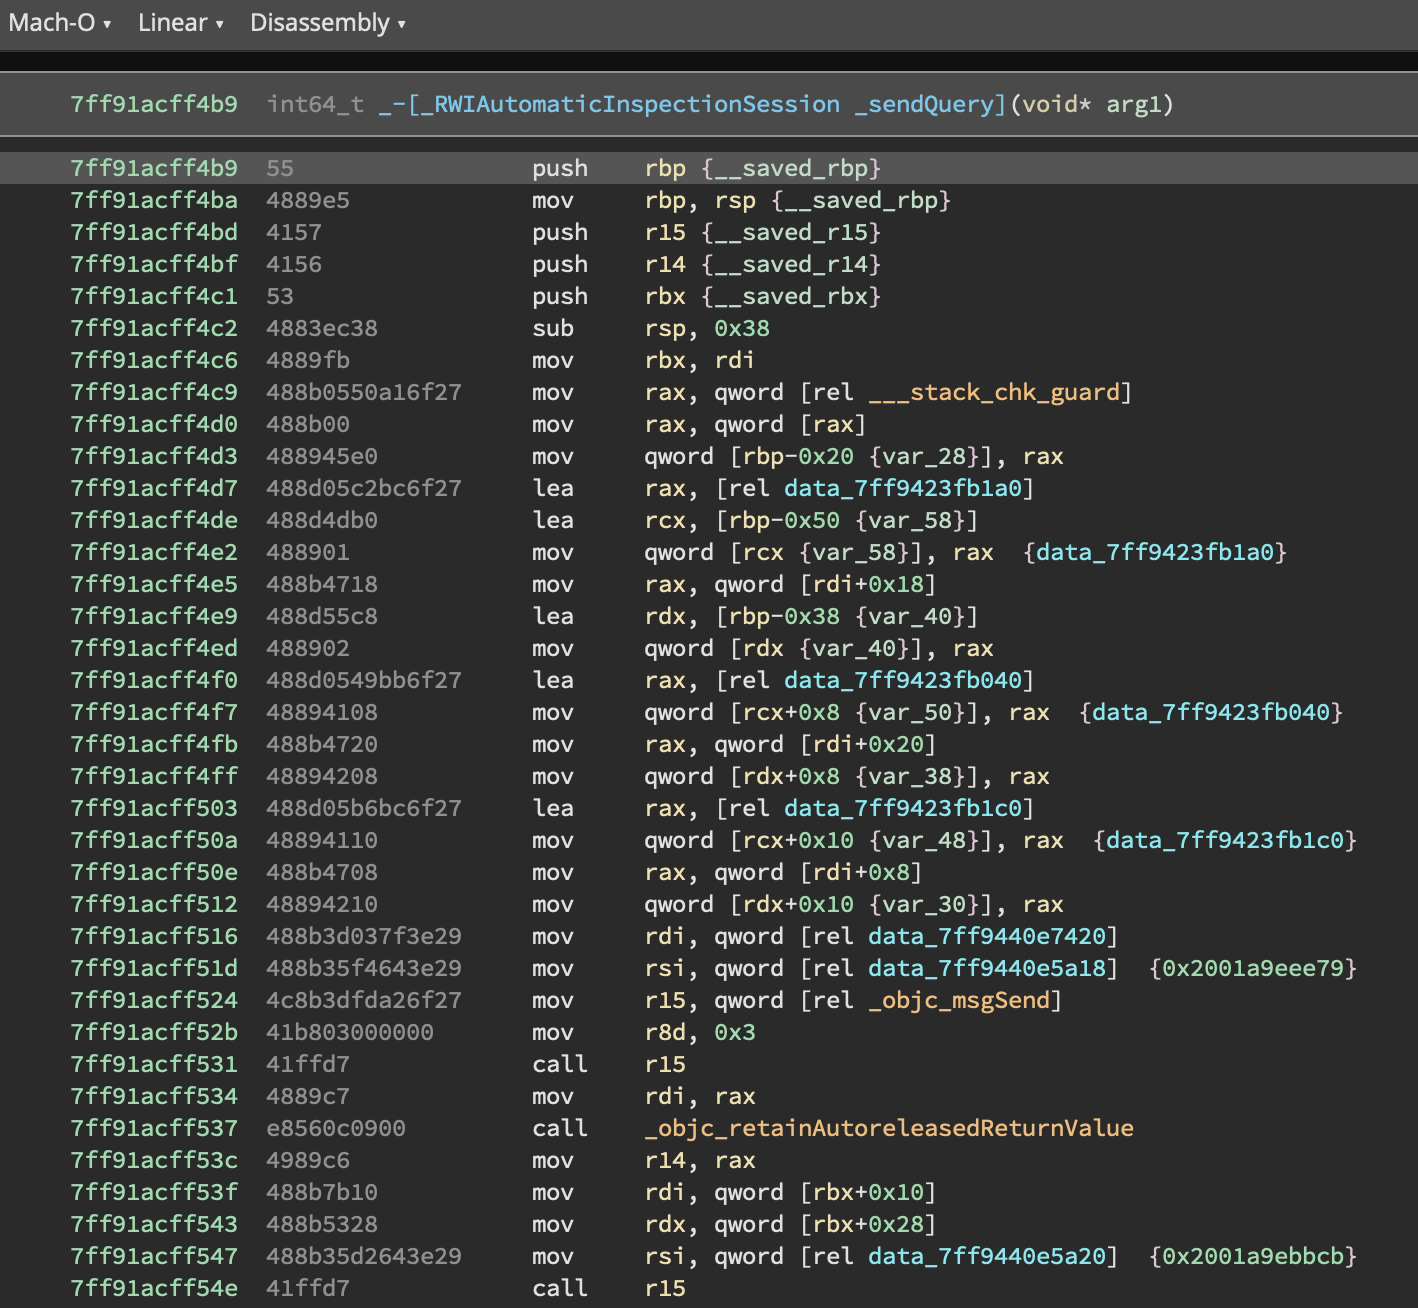
Without the plugin (Disassembly)
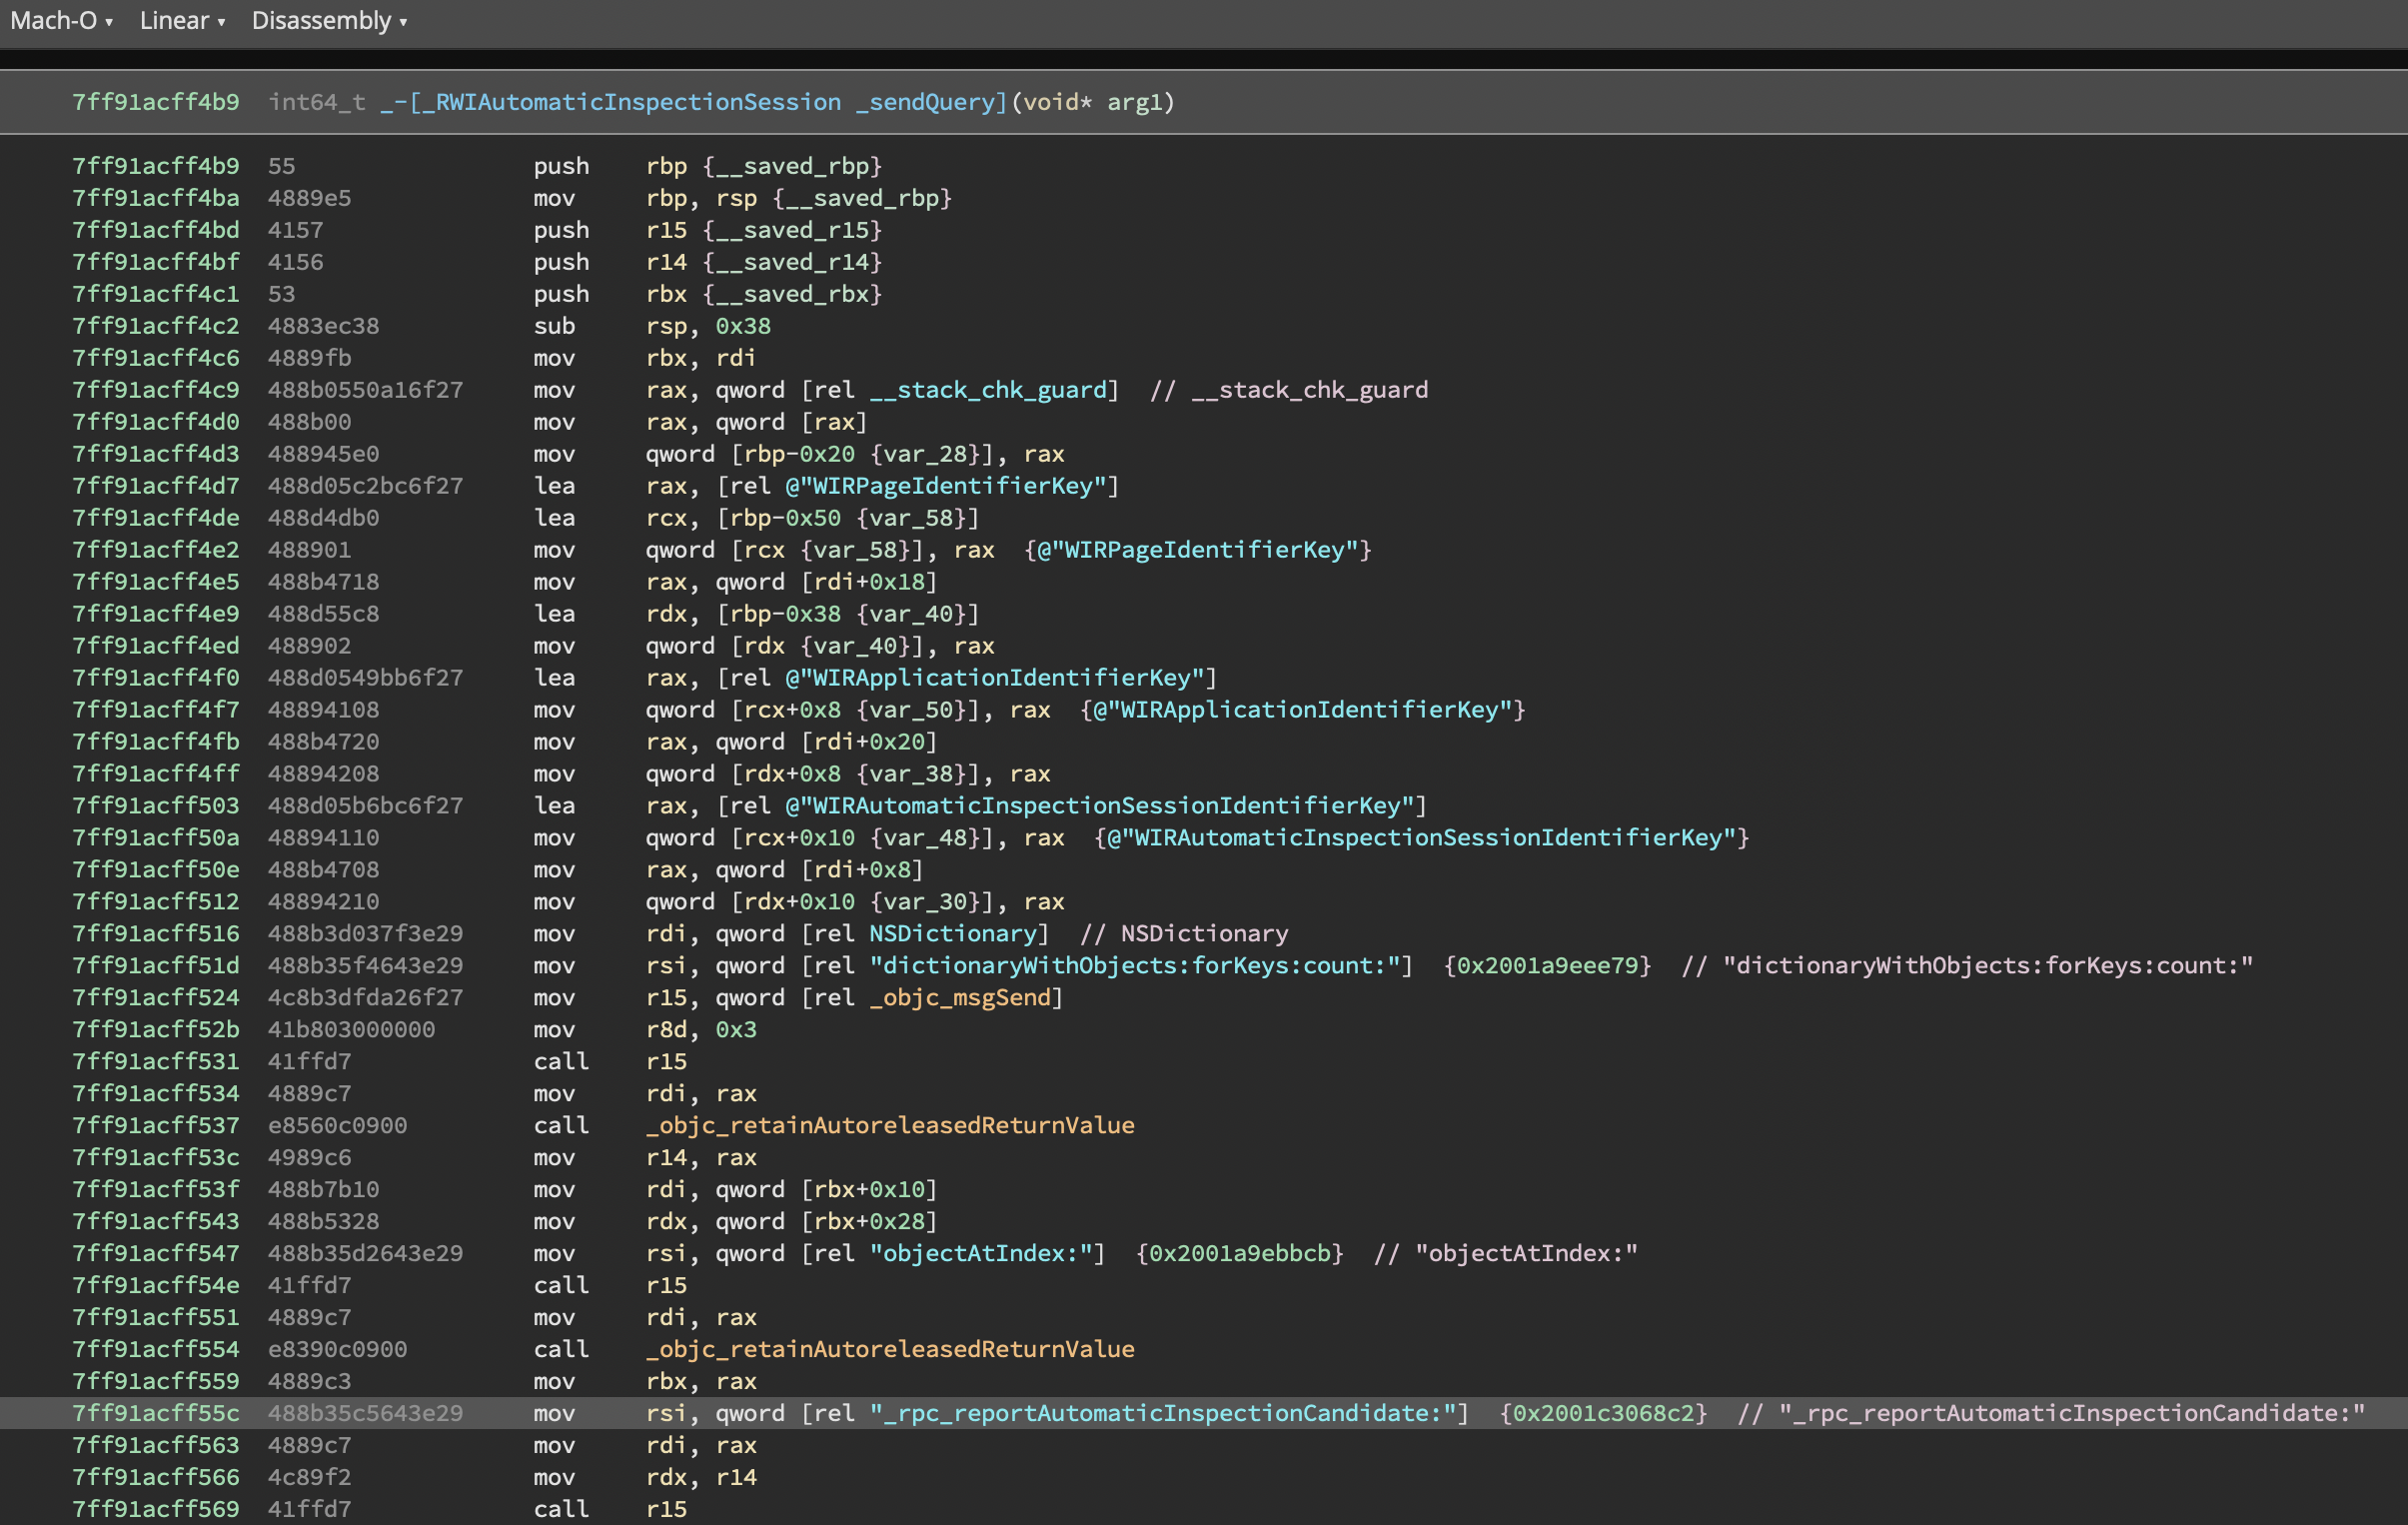
With the plugin (Disassembly)
Honestly, the annotations & namings are close to being perfect:
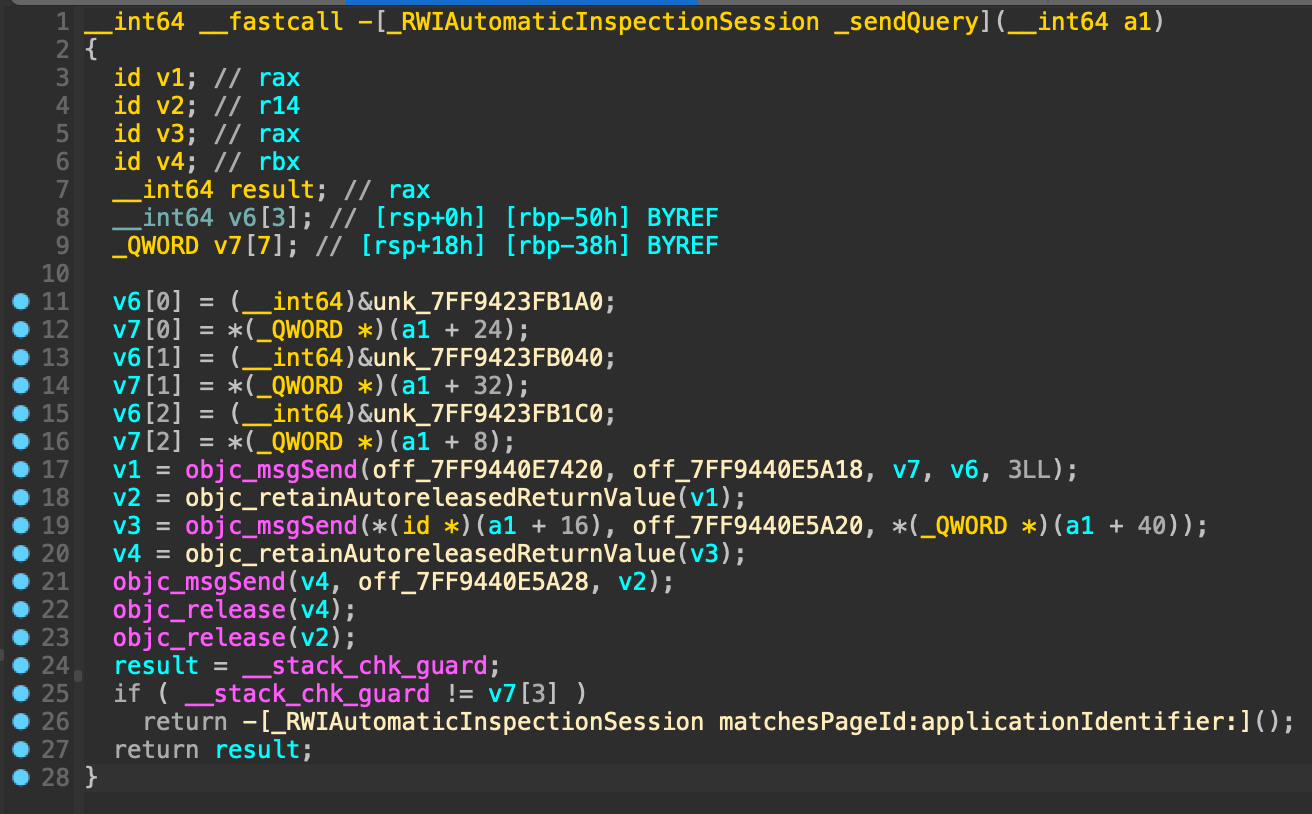
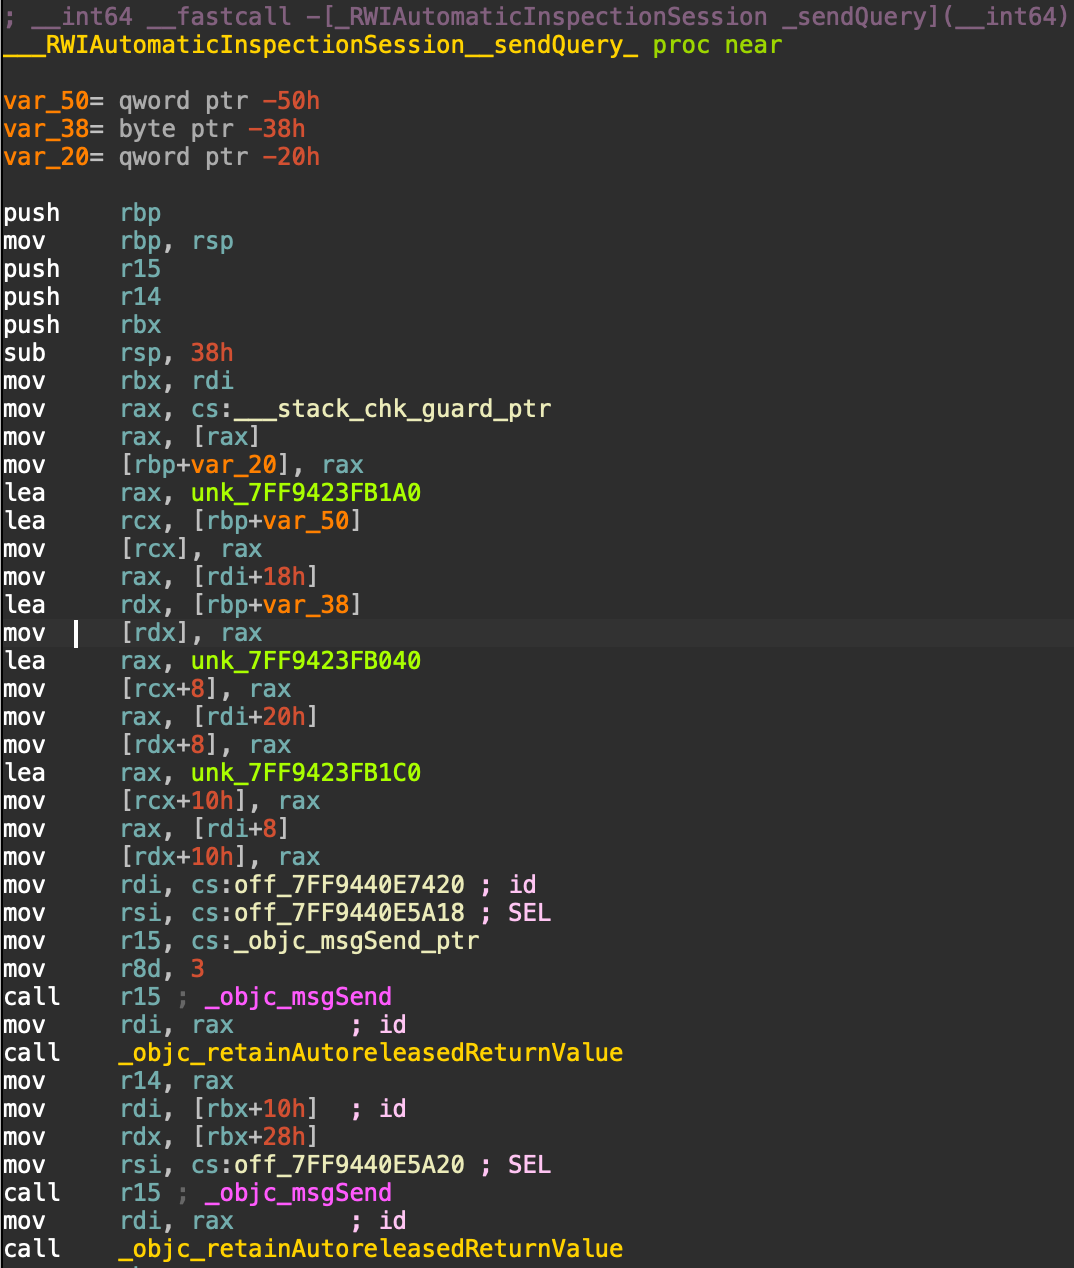
Impressive, but I use iDa pRo
Good luck on that (7.7.211224
IDA Freeware below):
Backstory
This story happened in April 2022, while I was attending the Program Analysis for Vulnerability Research training by Margin Research & Vector35. That was just after I did Reverse Engineering and Demystifying *OS Private Frameworks for my university classes.
I was sitting in my chair thinking about reverse engineering one of Apple’s Private Frameworks (you read it right, “thinking”). Casually loaded it in
Binary Ninja, selected the
Objective-Ninja workflow, and got greeted with this:
 I was devastated. My life was ruined. I wanted to die.
Jokes aside, I thought that I needed to link the .dylib with my Xcode project, resolve the method that I want to look at during the runtime with LLDB, STEAL the information from it, and apply that in my beloved Binary Ninja manually. That is a Sisyphean labor.
Of course,
LLDB is great when it comes to resolving some of the important Objective-C runtime information, such as selectors or NSStrings for example:
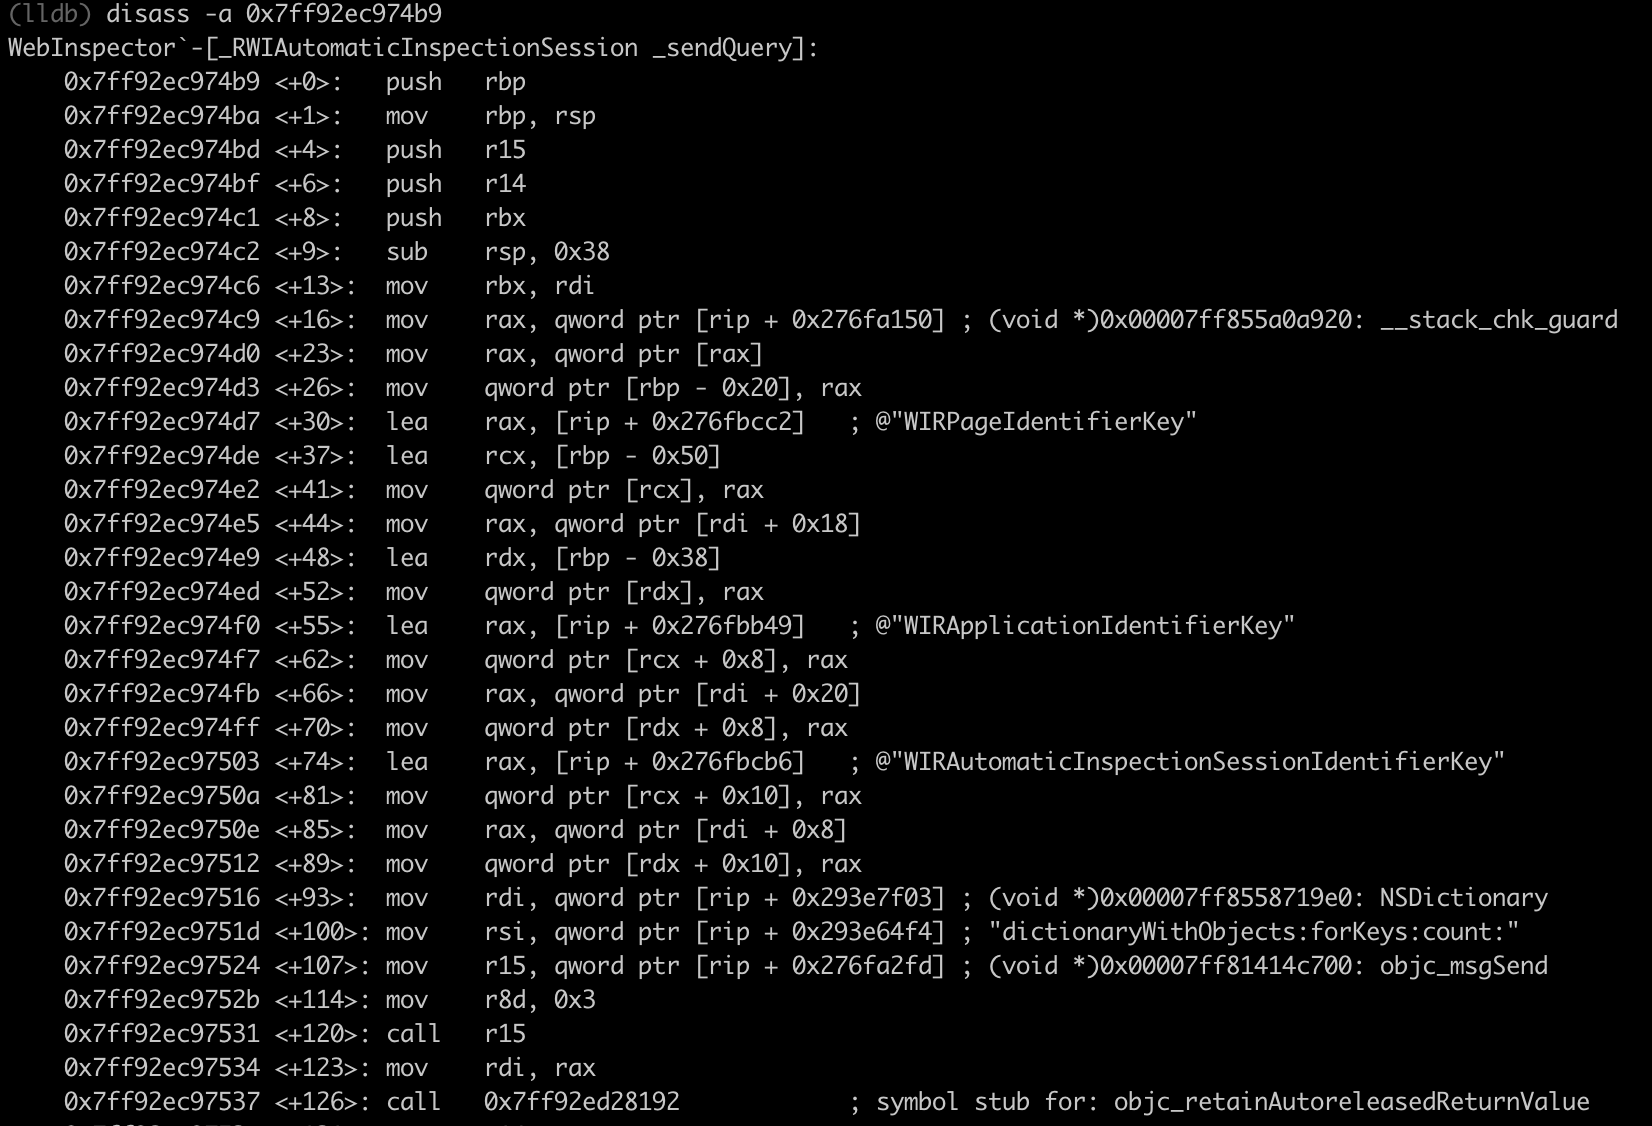 If only I could apply all this information to my reverse engineering tool of the choice…
An idea comes to mind
Static analysis or dynamic analysis, reverse engineering theory… No! I will choose my own destiny. I will make a plugin. A plugin that makes my static analysis “gigavaxxed” with the power of dynamic analysis.

Note: Binary Ninja has an AMAZING set of APIs. Refer to the docs for more information on them.
For a given .dylib function or a .dylib itself, my plugin compiles an Xcode project with an altered code that will resolve the function’s pointer. Then, it is analyzed in LLDB and the runtime information from that is propagated to the Binary Ninja, where comments are added and variables are renamed (effectively enhancing our static analysis).
Time - before one runs away
One would say, “It will take a huge amount of time”.

I would answer, YES. Dynamic analysis ( LLDB) itself is costly, not even taking the Xcode project building & running into account. Moreover, the Big O notation would probably have died from a heart attack if my python code was ever EXPOSED to it.
BUT, the time spent is WORTH IT. The plugin also runs on a separate thread so it won’t bother your analysis.
For example, the time needed to decorate the whole TCC.Framework C-like export table using my plugin (tests were done on my M1 MacBook with 99999 Safari tabs open, PyCharm running, and Burp Suite + Chromium devouring my RAM and CPU in the background):
x86_64: 137 functions decorated, 17.85 minutes elapsed.
arm64: 137 functions decorated, 11.87 minutes elapsed.
Clearly shows why arm64 is the future.
Funnily, it also triggered this alert (if somebody could explain to me what happened, I would be very grateful):
 All I was doing is resolving the function’s pointer, attaching to it with
LLDB and breaking at main:
| |
TCCAccessSetForBundleIdAndCodeRequirement is also mentioned by Wojciech Reguła here. Amusing that only resolving that function’s pointer triggers such a pop-up.
What about the Objective-C methods? I used the following technique:
| |
Benchmark of AppleMobileFileIntegrity.Framework:
x86_64: 99 methods decorated, 5.93 minutes elapsed.
Impressive!
Automation is the key
I coded this simple LLDB python script to dump the function and save the PRECIOUS runtime information:
| |
For the Binary Ninja, I created my LLDBDecorator class which inherits from BackgroundTaskThread to enable threading:
| |
I also coded the ldb_decorate method to set everything up, automate Xcode + LLDB routines and populate Binary Ninja with results:
| |
We can ABUSE python “TeMpLaTeS” (f-strings) for the changes in code:
| |
| |
I also added an option for C-like imports (as shown during the TCC benchmark):
| |
Code
Unfortunately, at the end of the day, my MacBook overheated, malfunctioned, started to burn, and exploded. This is so sad and that is why I couldn’t provide the full codebase.
Well, jokes aside, this is still very much work-in-progress and I cannot provide the project code in the state it is right now (please do not HACK and EXPOSE me). I am also confident that many Security Researchers are more experienced than I am, so reimplementing this project shouldn’t take a lot of time given the effort and information above (personally did it in two days).
In the worst case, DM me on Twitter for the source code.
Grand Finale
Thank you for reading this and I hope you learned something new or at least explored an interesting case study that may push you to your great ideas.
I may also do a second take on this project if it interests people.
@Daniil Nababkin (cr7pt0pl4gu3)